OpenStatus
Monitor uptime, coordinate incidents, and keep subscribers informed
Explore production telemetry with dashboards, monitoring and incident investigation tools.
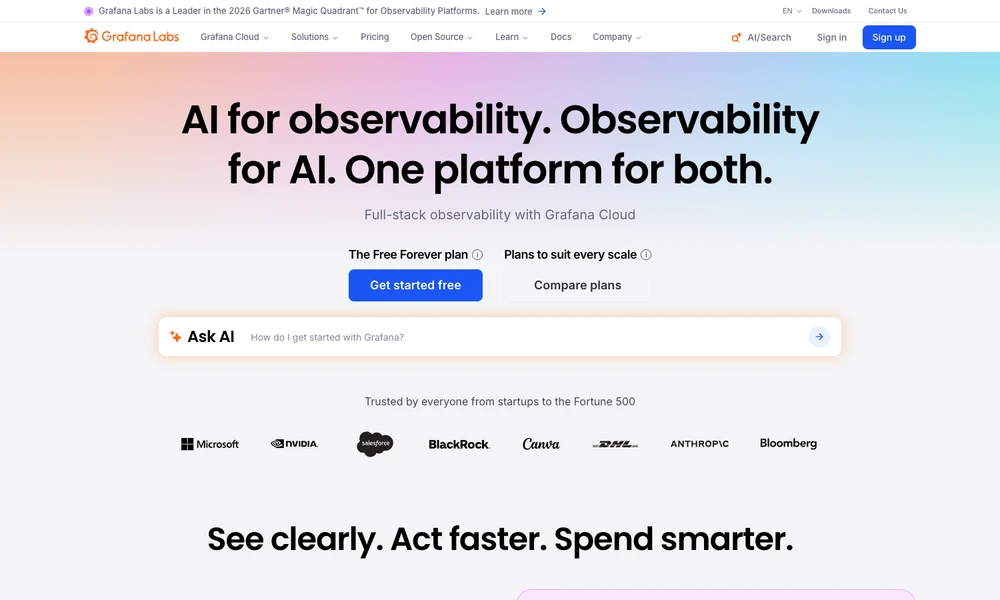
Grafana brings metrics, logs, traces, and other operational signals into dashboards and investigation tools. Teams can connect existing data sources and build views around the questions they need to answer about a system. Its ecosystem includes open-source tools and the managed Grafana Cloud platform, with support for standards such as OpenTelemetry and Prometheus.
Cloud services cover application, infrastructure, database, and frontend observability, alongside synthetic checks and incident response. AI assistance can help interpret telemetry and investigate an issue. Engineers can compare signals during a failure, follow behavior over time, and share dashboards that give different teams context about the same application.
Tried it? Share a useful thought or ask a question.
Good conversations start with a hello.
Sign in to commentMonitor uptime, coordinate incidents, and keep subscribers informed
Monitor production changes and investigate incidents with AI
Combine AI traces with logs, metrics, and application observability
Route, inspect, and monitor requests across AI applications
Inspect coding-agent traces, token usage, and execution costs
Combine incident workload and team feedback to understand on-call strain.