
Monday Merch Design Studio
Create branded merchandise and print designs from a prompt
Turn information into infographics and visual reports
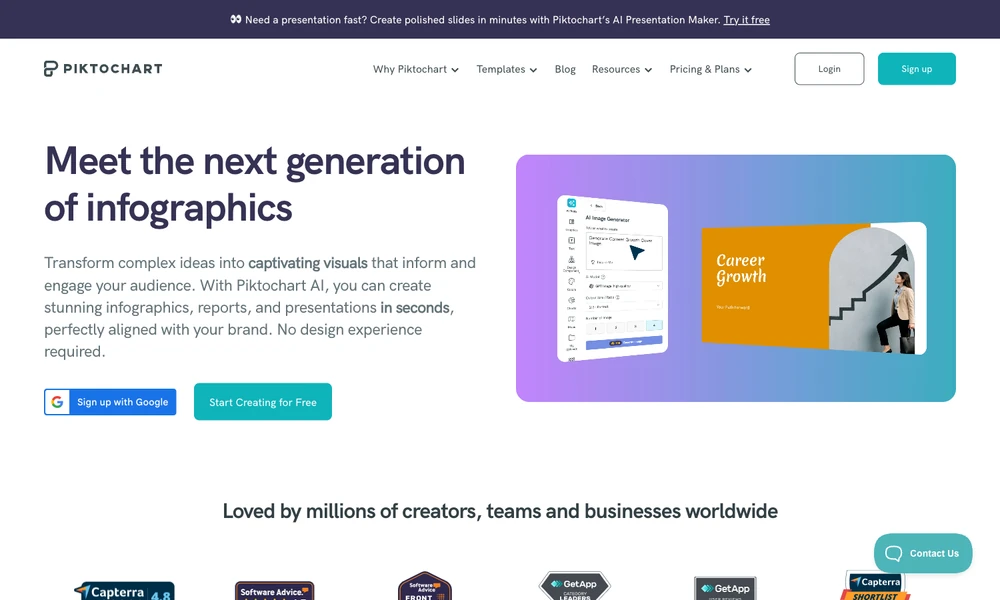
Piktochart helps present information through infographics, reports, presentations, and other visual formats. Choose a template, organize the content, and use charts, maps, tables, diagrams, icons, or photos to explain it. The editor lets you adjust the layout for a report, lesson, team update, or marketing piece.
Brand assets store the fonts, colors, and logos a team uses, with branded templates for recurring work. AI tools generate visual drafts and assist with image or video creation and editing. You can review that starting material, correct the wording and data presentation, and refine its appearance before sharing the finished communication.
Tried it? Share a useful thought or ask a question.
Good conversations start with a hello.
Sign in to commentCreate branded merchandise and print designs from a prompt
Design editable social carousels from topics, links, or notes
Make social graphics, ads and blog images from ready-sized templates.
Create graphics, presentations, and branded content
Create branded graphics, presentations and print materials in a visual workspace.
Create and render reusable designs through APIs and AI agents.