

Metabase
Explore business data with shared metrics
Explore data and build interactive dashboards
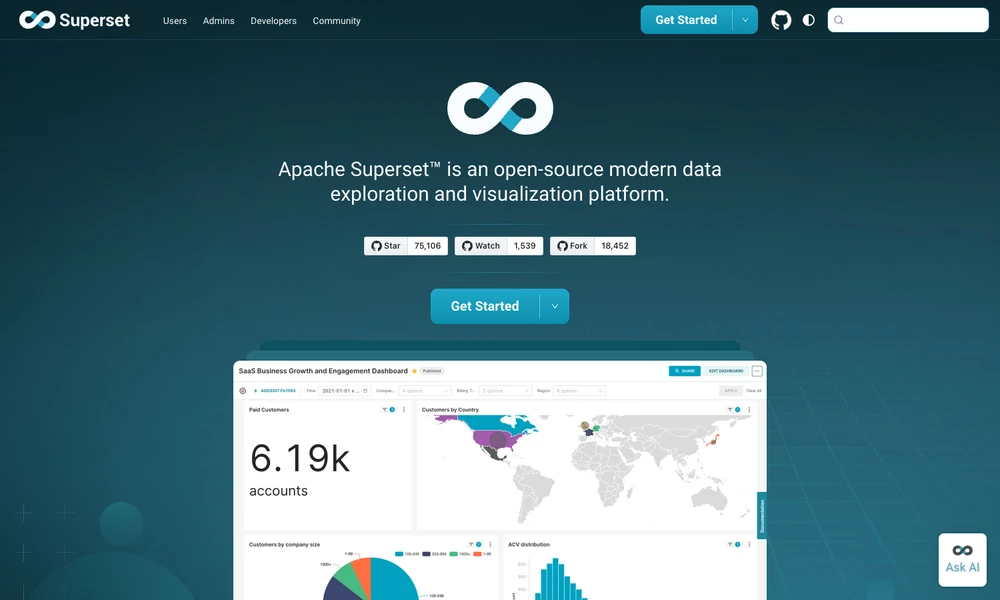
Apache Superset lets people explore SQL data and assemble interactive dashboards. Use the visual chart builder or write queries in SQL Lab, then work from physical or virtual datasets with shared metric definitions. A semantic layer provides a place for SQL transformations used across the analysis.
The chart library covers conventional and geospatial views, with extensions available for other visualizations. Dashboard filters, cross-filtering, and drill-down tools let viewers investigate details beyond the initial chart. Superset queries connected databases and uses the organization's existing data infrastructure. Administrators manage deployment, drivers, caching, and access, while analysts build the reports that run within that environment.
Tried it? Share a useful thought or ask a question.
Good conversations start with a hello.
Sign in to commentExplore business data with shared metrics
Build interactive business reports around shared data models and metrics
Explore data visually and share interactive analysis across your organization
Build reports, dashboards, and analytics agents from a version-controlled project.
Share modeled business data with your team and AI agents
Analyze connected data and create charts through natural-language requests