
Posit
Develop and share work in R and Python
Manage research data, run statistical analyses, and produce reproducible reports
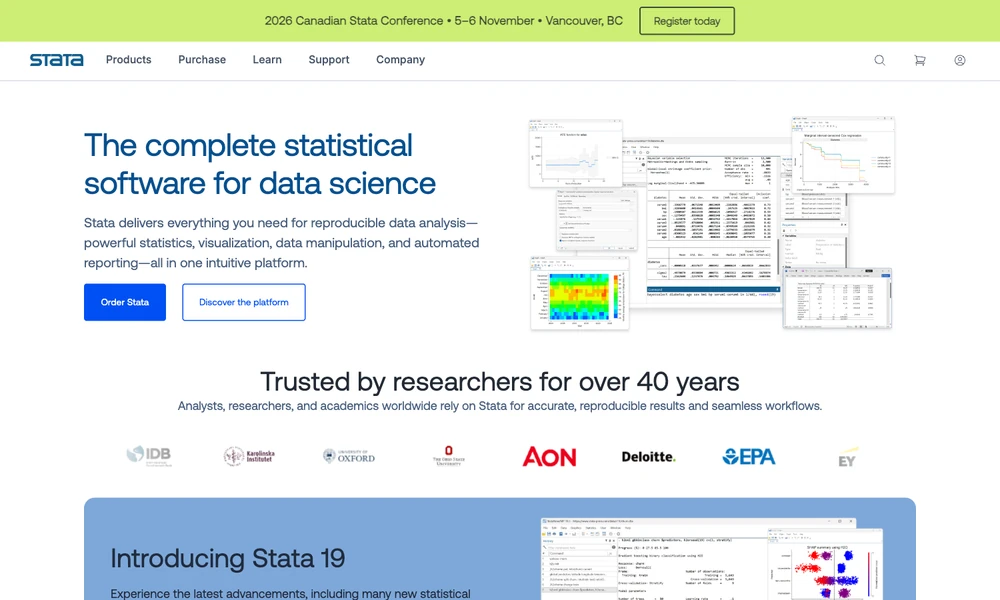
Stata combines dataset preparation, statistical modeling, visualization, and reporting in a research application. Analysts can manage the data, apply methods suited to a study, and produce tables or graphics from the same workflow. It is used across fields such as economics, public health, education, and the social sciences.
Graph controls adjust labels, colors, and layouts, with exports for incorporating the result into a publication. Automated reporting carries analysis into recurring outputs, while documentation provides method explanations and worked examples. Researchers can keep the data manipulation and analysis steps together, then revise the calculations and regenerate the tables or graphs when the study's inputs change.
Tried it? Share a useful thought or ask a question.
Good conversations start with a hello.
Sign in to commentDevelop and share work in R and Python
Analyze files and create charts through a conversational workspace
Prepare data and run statistical tests, regression, and forecasts
Develop numerical algorithms and explore engineering data in an interactive environment
Interactive notebooks for code, data, and explanation
Run classical and Bayesian statistics through a visual interface