

Honeycomb
Explore production traces and investigate unusual behavior
Trace model calls, tool steps, and costs across AI-agent runs
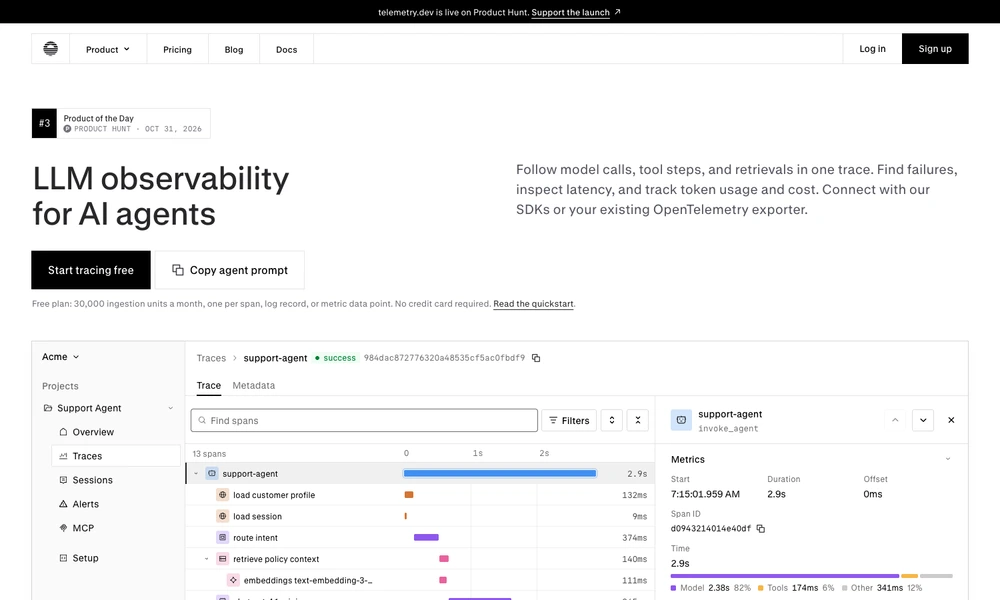
telemetry.dev helps developers understand what happens inside an AI-agent run. Model calls, retrievals, and tool steps appear in a shared trace so you can inspect failures, compare latency, and follow token use and cost. Applications can send telemetry through the service’s SDKs or an existing OpenTelemetry exporter, keeping the investigation tied to actual execution data.
Additional tools cover MCP traffic, alerts for unusual cost or error patterns, prompt versions, and evaluation runs. Teams can connect a coding agent to help add instrumentation and investigate recorded behavior. A free plan provides a starting allowance, with paid options for more usage. The service is intended for monitoring and improving applications that use models and external tools.
Tried it? Share a useful thought or ask a question.
Good conversations start with a hello.
Sign in to commentExplore production traces and investigate unusual behavior
Route, inspect, and monitor requests across AI applications
Inspect coding-agent traces, token usage, and execution costs
Monitor model requests and review ways to reduce LLM operating costs.
Combine AI traces with logs, metrics, and application observability
Investigate production issues and propose fixes as pull requests