
New Relic
Application monitoring with connected telemetry and traces
Monitoring for applications, infrastructure, logs, and security
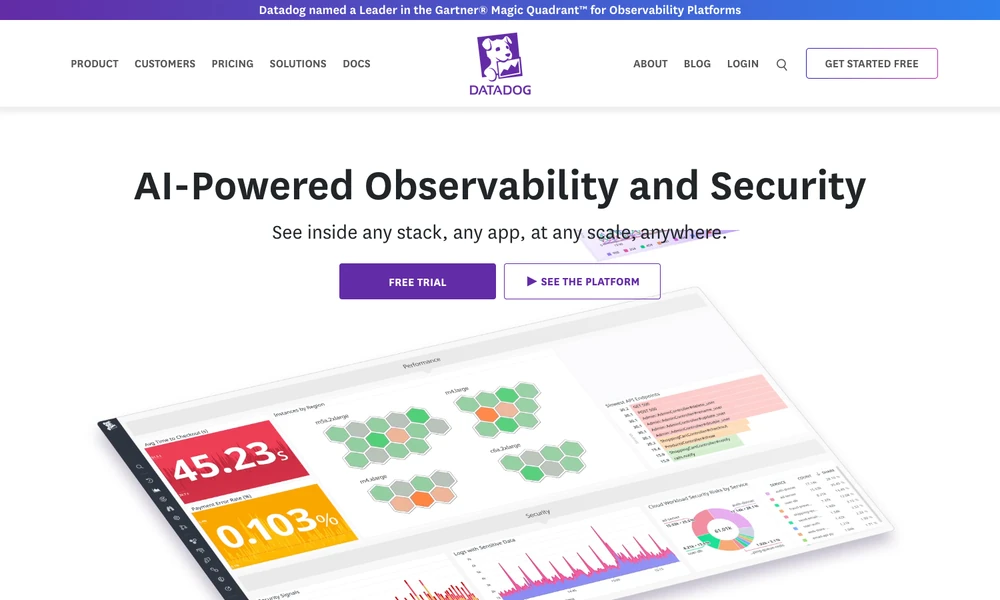
Datadog collects telemetry from applications and infrastructure for operations and investigation. Application performance monitoring, logs, host and container data, and network monitoring provide different views of a system's behavior. Dashboards place related measurements together for review.
Synthetic checks test defined service behavior, while real-user monitoring records activity from actual sessions. Cloud-cost and security tools add further operational information. A team investigating a slow request can inspect application traces, logs, and the resources involved, correlating the records around the same issue. Product selection and integrations determine which parts of the environment contribute data to those investigations.
Tried it? Share a useful thought or ask a question.
Good conversations start with a hello.
Sign in to commentApplication monitoring with connected telemetry and traces
Explore production traces and investigate unusual behavior
Route, inspect, and monitor requests across AI applications
Inspect coding-agent traces, token usage, and execution costs
Monitor model requests and review ways to reduce LLM operating costs.
Combine AI traces with logs, metrics, and application observability