Datadog
Monitoring for applications, infrastructure, logs, and security
Application monitoring with connected telemetry and traces
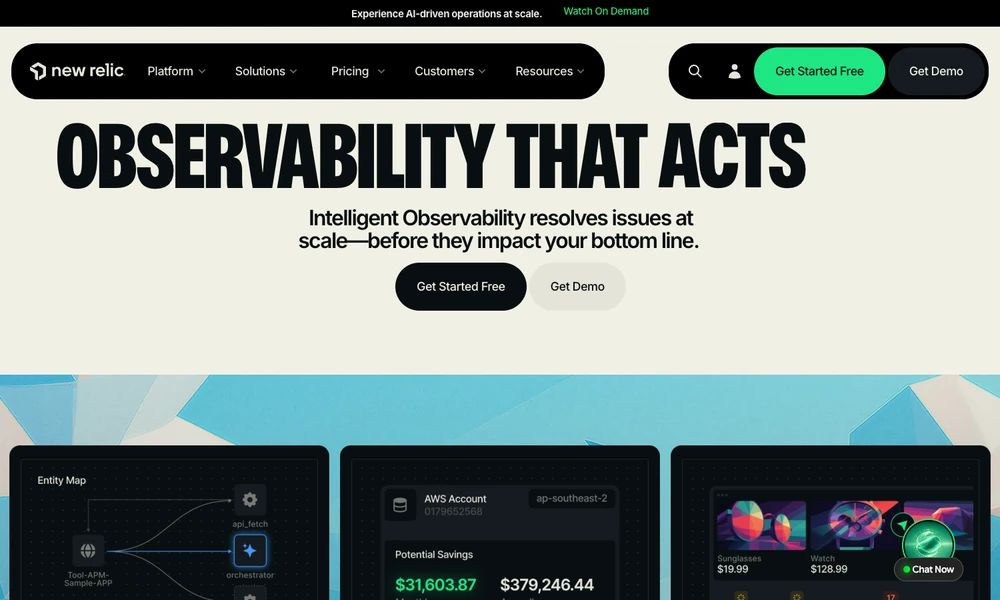
New Relic brings application, infrastructure, and log data into an observability platform. Engineers examine errors, latency, and service relationships using the connected signals. Digital-experience monitoring and session replay add information about what a user encountered, while cloud-spending views cover operational costs.
AI and agent monitoring traces applications that call models or coordinate agents, connecting their activity with the underlying services. OpenTelemetry support uses a common instrumentation standard, and integrations make observability context available to AI tools. During an investigation, a team can inspect the application behavior and the signals associated with a release or incident.
Tried it? Share a useful thought or ask a question.
Good conversations start with a hello.
Sign in to commentMonitoring for applications, infrastructure, logs, and security
Route, inspect, and monitor requests across AI applications
Inspect coding-agent traces, token usage, and execution costs
Monitor model requests and review ways to reduce LLM operating costs.
Combine AI traces with logs, metrics, and application observability
Connect application errors with the context to fix them.