
Helicone
Route, inspect, and monitor requests across AI applications
See live infrastructure health on an architecture diagram
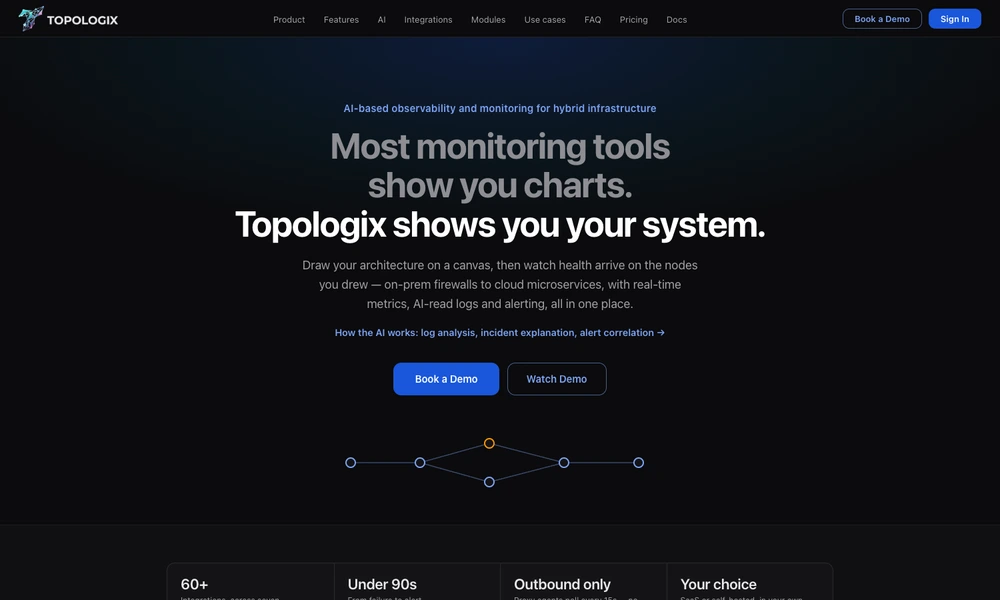
Topologix puts live monitoring data on the architecture diagram an operations team uses to explain its systems. Draw a service and its dependencies, import an existing Visio or draw.io file, or use a screenshot of a diagram as a starting point. Nodes then display the health of the equipment or service they represent, from an on-premises firewall to a cloud application. Teammates can edit the diagram together and revisit saved versions. During an incident, the map gives them a place to connect alerts with metrics and logs.
Tried it? Share a useful thought or ask a question.
Good conversations start with a hello.
Sign in to commentRoute, inspect, and monitor requests across AI applications
Inspect coding-agent traces, token usage, and execution costs
Monitor model requests and review ways to reduce LLM operating costs.
Combine AI traces with logs, metrics, and application observability
Investigate production issues and propose fixes as pull requests
Explore production telemetry with dashboards, monitoring and incident investigation tools.