

Highcharts
Build interactive charts and data interfaces with JavaScript
Combine code, data, and interactive explanations in collaborative notebooks
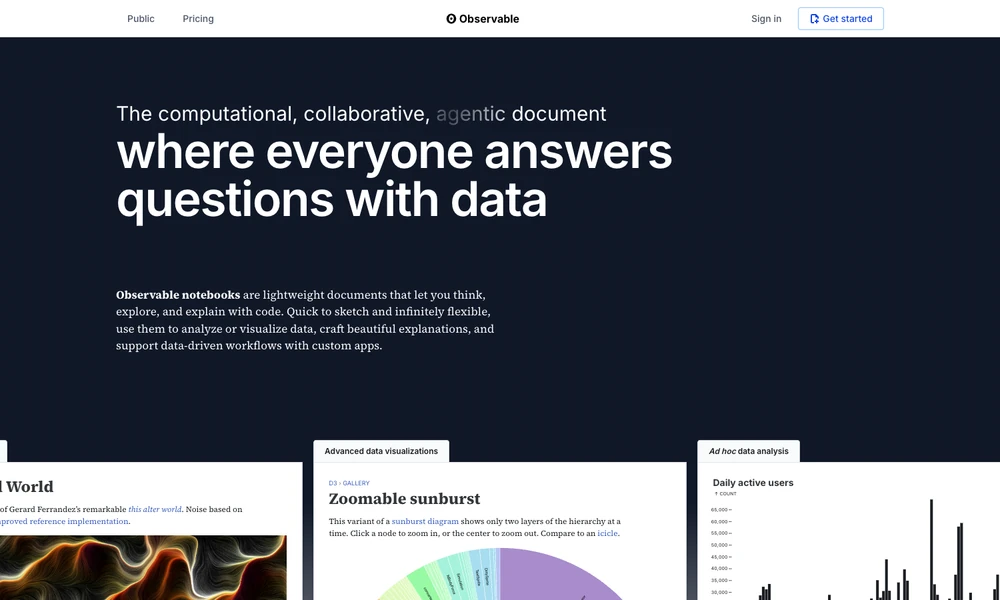
Observable notebooks combine executable code, data, charts, and explanation in an interactive document. Analysts can use SQL alongside JavaScript or TypeScript, add text around a calculation, and give readers controls for exploring the result. Changing an input updates the connected calculation and visualization within the notebook.
The format supports a quick analysis sketch, a custom chart, or a small application built around a dataset. Examples also include simulations and generative art. Collaboration and publishing tools let a team develop the work together or share an interactive explanation, keeping the code, data transformations, and displayed results connected in the same document.
Tried it? Share a useful thought or ask a question.
Good conversations start with a hello.
Sign in to commentBuild interactive charts and data interfaces with JavaScript
Turn datasets into charts and publishable visual stories
Create charts, maps, and tables without code
Turn tabular data into editable charts with a free browser-based tool
Explore US public data with sources and reporting dates
Build interactive charts and Python data apps, then publish them for others