

Datawrapper
Create charts, maps, and tables without code
Turn tabular data into editable charts with a free browser-based tool
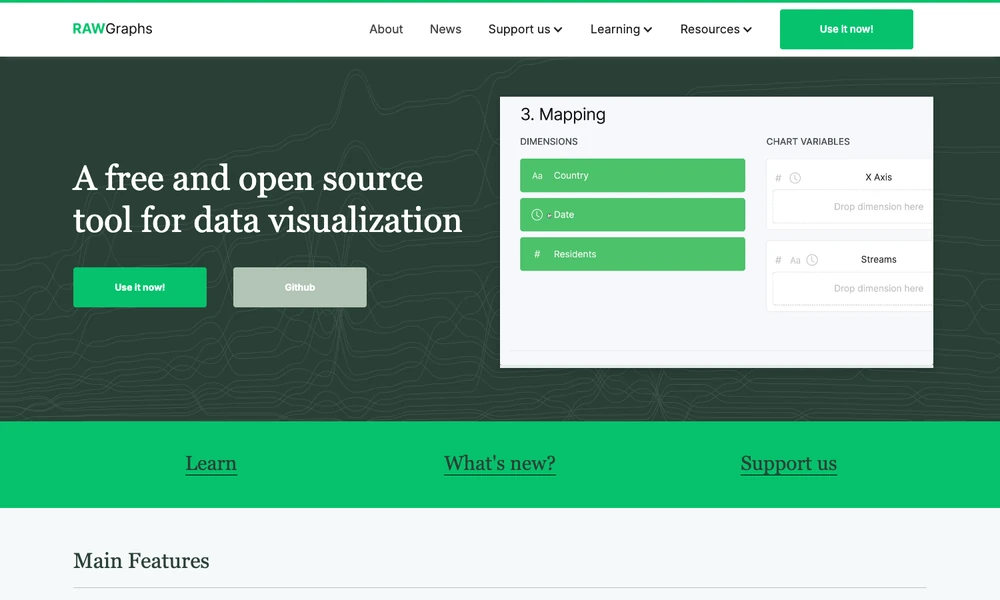
RAWGraphs creates data visualizations in a browser using a selection of chart models. Designers and researchers can choose a model suited to quantities, hierarchies, time series, or another data structure, then use the application to turn the dataset into a visual form. The entered data is processed by the browser.
Projects can be saved for further work, and charts can be exported as vector or raster images. Vector output provides a starting point for refining typography, colors, or layout in design software before placing a chart in a publication or presentation. The tool is open source, with learning resources and public code for exploring how the charts are produced.
Tried it? Share a useful thought or ask a question.
Good conversations start with a hello.
Sign in to commentCreate charts, maps, and tables without code
Build interactive charts and Python data apps, then publish them for others
Turn datasets into charts and publishable visual stories
Turn spreadsheet and structured data files into shareable dashboards
Combine code, data, and interactive explanations in collaborative notebooks
Create interactive charts, maps, and reports from your data