

RAWGraphs
Turn tabular data into editable charts with a free browser-based tool
Build interactive charts and Python data apps, then publish them for others
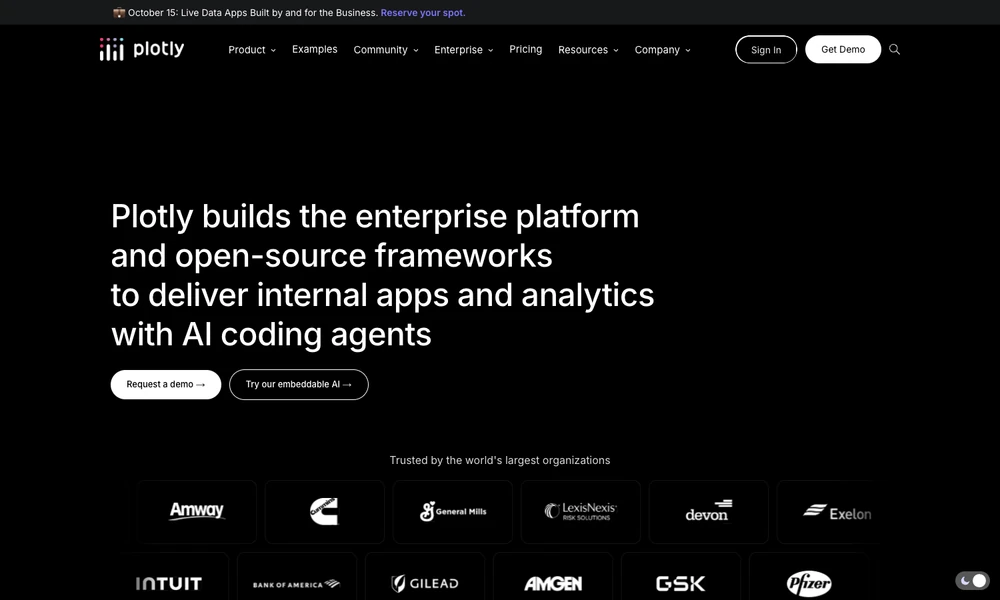
Plotly provides graphing libraries and tools for building analytical applications. Its open-source libraries create interactive browser charts from Python, R, or JavaScript, with image exports for using a chart in a report. Dash turns Python analysis into applications containing controls, visualizations, and interfaces for exploring data.
Plotly Studio uses AI to create analyses and apps backed by code that developers can inspect. Plotly Cloud hosts published applications, while Dash Enterprise supports deployment within an organization's infrastructure. A developer can start with a script that draws a chart, then build a Dash interface where colleagues change parameters and investigate the underlying data themselves.
Tried it? Share a useful thought or ask a question.
Good conversations start with a hello.
Sign in to commentTurn tabular data into editable charts with a free browser-based tool
Create interactive charts, maps, and reports from your data
Turn datasets into charts and publishable visual stories
Create charts, maps, and tables without code
Combine code, data, and interactive explanations in collaborative notebooks
Turn data into interactive visual stories