

RAWGraphs
Turn tabular data into editable charts with a free browser-based tool
Create charts, maps, and tables without code
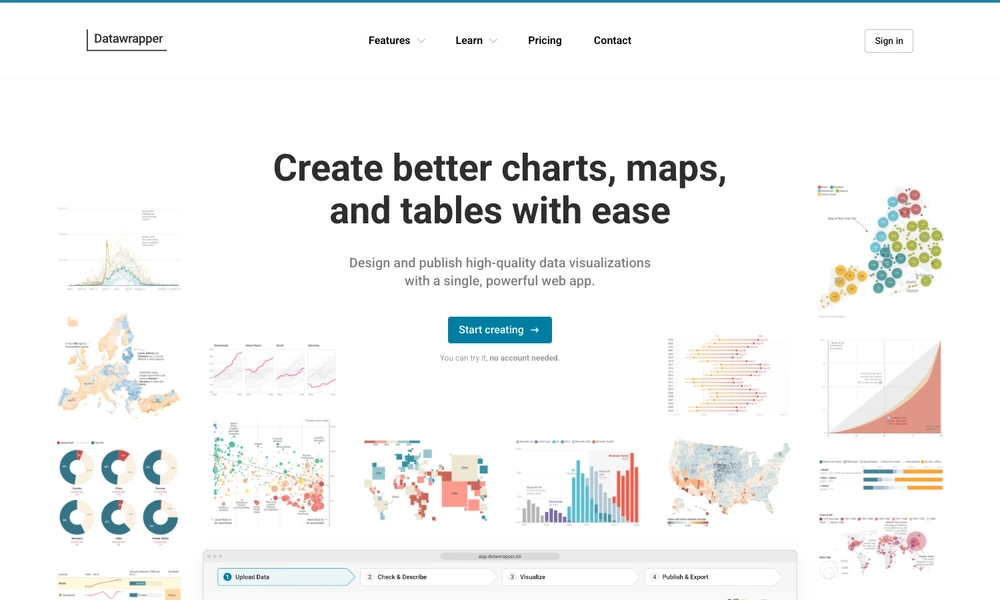
Datawrapper is a browser editor for turning data into charts, maps, and tables for publication. Work through the data and visualization choices, then adjust labels, annotations, colors, and typography. Responsive previews show the graphic at different sizes before it is used in a page or presentation.
Visualizations can be embedded online or prepared for print and slides. Team tools include shared folders, reusable themes, comments, and collaborative editing. After publication, an editor can revise the data or graphic and republish it. That keeps a report available for corrections or updates without recreating its visual style each time.
Tried it? Share a useful thought or ask a question.
Good conversations start with a hello.
Sign in to commentTurn tabular data into editable charts with a free browser-based tool
Turn data into interactive visual stories
Create interactive charts, maps, and reports from your data
Turn datasets into charts and publishable visual stories
Build interactive charts and Python data apps, then publish them for others
Turn spreadsheet and structured data files into shareable dashboards