

Datawrapper
Create charts, maps, and tables without code
Turn datasets into charts and publishable visual stories
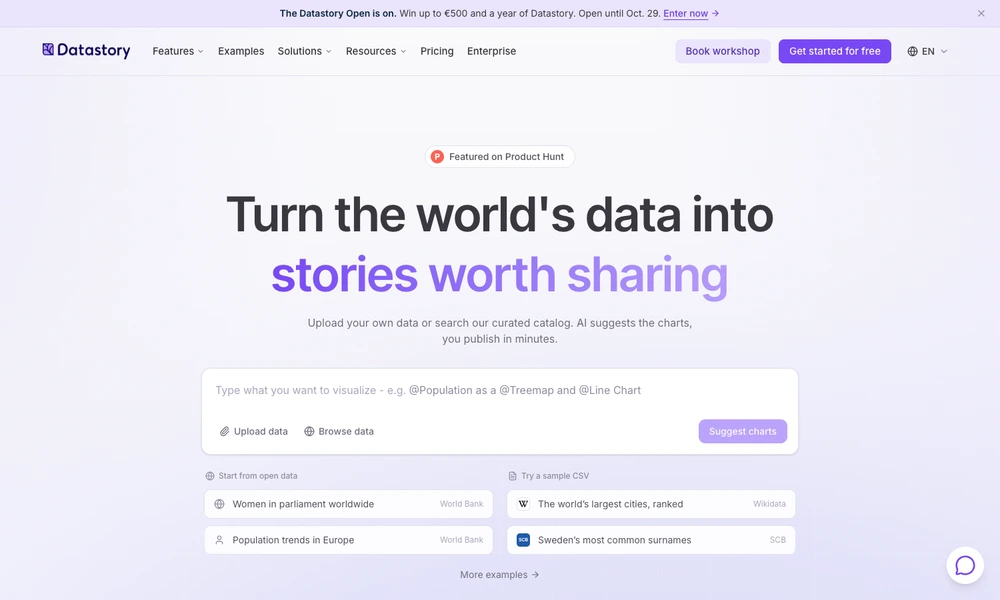
Datastory helps people turn data into charts and visual stories for publication. Users can upload a spreadsheet or CSV, connect linked data, or explore a catalog of public datasets. AI assistance suggests chart types and possible angles based on the available tables, while the author can refine captions, annotations, colors, and source notes.
The chart library covers common formats such as bars, lines, scatter plots, and treemaps, with responsive layouts for embedding in websites. Finished work can be shared through a standalone link, embedded in a content system, or exported as an image. Editorial templates and brand controls support recurring reporting workflows without requiring each visualization to be built from scratch.
Tried it? Share a useful thought or ask a question.
Good conversations start with a hello.
Sign in to commentCreate charts, maps, and tables without code
Turn tabular data into editable charts with a free browser-based tool
Build interactive charts and Python data apps, then publish them for others
Ask questions about connected business data and receive charts and reports in Slack.
Turn spreadsheet and structured data files into shareable dashboards
Combine code, data, and interactive explanations in collaborative notebooks