

Datastory
Turn datasets into charts and publishable visual stories
Ask questions about connected business data and receive charts and reports in Slack.
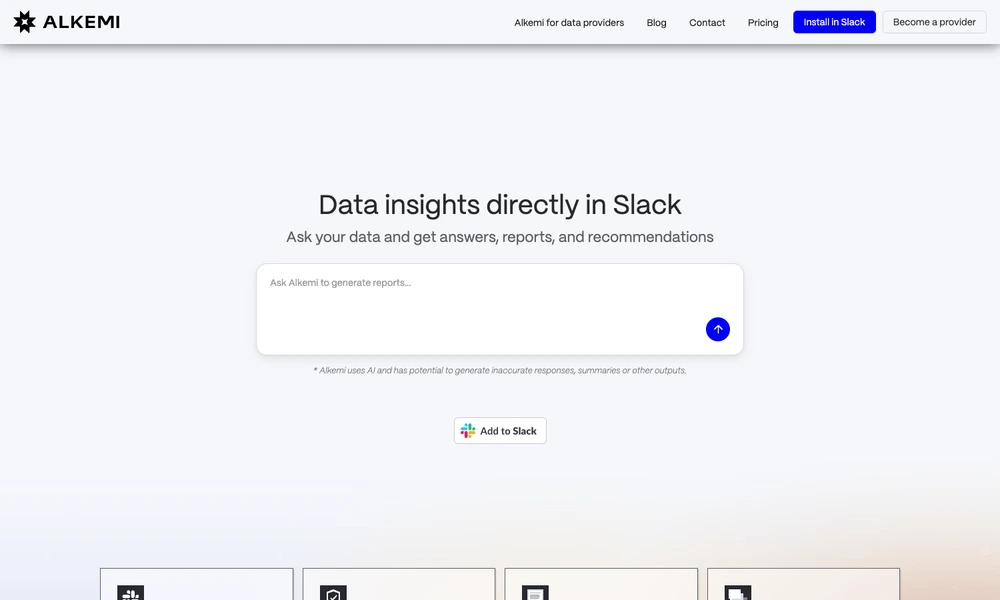
Alkemi brings questions about business data into Slack conversations. After connecting the workspace and relevant data sources, a team can ask for figures, comparisons, and summaries in a channel. Responses can include charts and reports, with permission controls and audit logs supporting access to the connected records.
Colleagues can refine a question together in a thread and build on the resulting analysis. The service presents workflows for revenue performance, channel demand, pricing, margins, and category trends. It is intended to make exploratory data questions available where teams already communicate, with AI-generated results remaining material to check against the underlying sources.
Tried it? Share a useful thought or ask a question.
Good conversations start with a hello.
Sign in to commentTurn datasets into charts and publishable visual stories
Create charts, maps, and tables without code
Turn tabular data into editable charts with a free browser-based tool
Build interactive charts and Python data apps, then publish them for others
Explore US public data with sources and reporting dates
Combine code, data, and interactive explanations in collaborative notebooks