

Datawrapper
Create charts, maps, and tables without code
Turn data into interactive visual stories
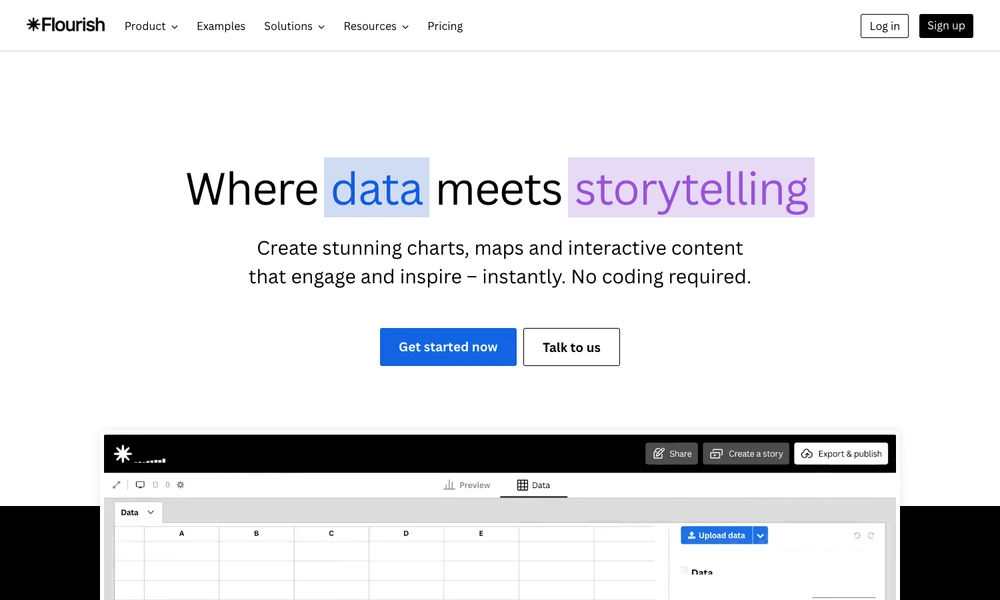
Flourish makes interactive charts, maps, and visual stories from data. Import a dataset, choose a format, and adjust the appearance and behavior of the visualization. Stories and scrollytelling connect several views into a sequence the reader can explore.
Embed finished work on a website or use it in presentations and other publishing formats. Team sharing and brand controls support organizations making recurring graphics. The Connector lets you start in an AI tool, and the Assistant helps refine the result in Flourish. An API supports developer workflows. You can keep adjusting both the data presentation and the visual treatment as the story takes shape.
Tried it? Share a useful thought or ask a question.
Good conversations start with a hello.
Sign in to commentCreate charts, maps, and tables without code
Turn datasets into charts and publishable visual stories
Turn tabular data into editable charts with a free browser-based tool
Build interactive charts and Python data apps, then publish them for others
Combine code, data, and interactive explanations in collaborative notebooks
Create interactive charts, maps, and reports from your data