

Datawrapper
Create charts, maps, and tables without code
Create interactive charts, maps, and reports from your data
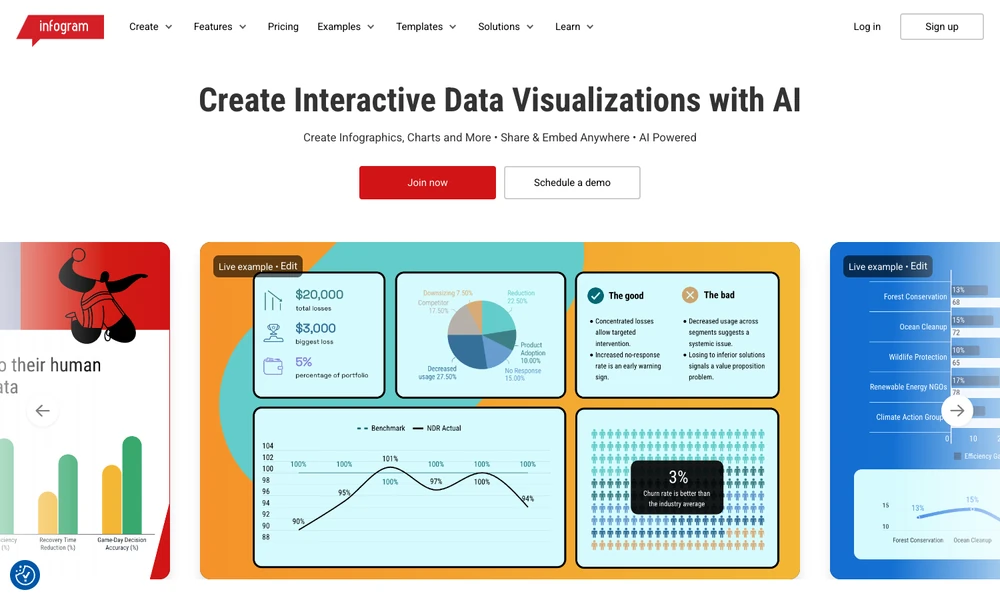
Infogram is a visual publishing tool for charts, maps, infographics, reports, and dashboards. You bring in data, choose a visualization or template, and adjust layout, colors, and branding for the audience. Interactive content can be embedded in a website or shared as a separate piece of material.
Team features support collaboration and consistent presentation across recurring reports. AI tools assist with tasks such as selecting visualizations or extracting data from an image, while available export options depend on the plan and format. The editor suits editorial, communications, and reporting work where people need to explain information visually without writing specialized charting code.
Tried it? Share a useful thought or ask a question.
Good conversations start with a hello.
Sign in to commentCreate charts, maps, and tables without code
Build interactive charts and Python data apps, then publish them for others
Turn datasets into charts and publishable visual stories
Turn tabular data into editable charts with a free browser-based tool
Combine code, data, and interactive explanations in collaborative notebooks
Turn data into interactive visual stories