

Datastripes
Turn spreadsheet and structured data files into shareable dashboards
Explore environmental and population estimates on a 3D globe
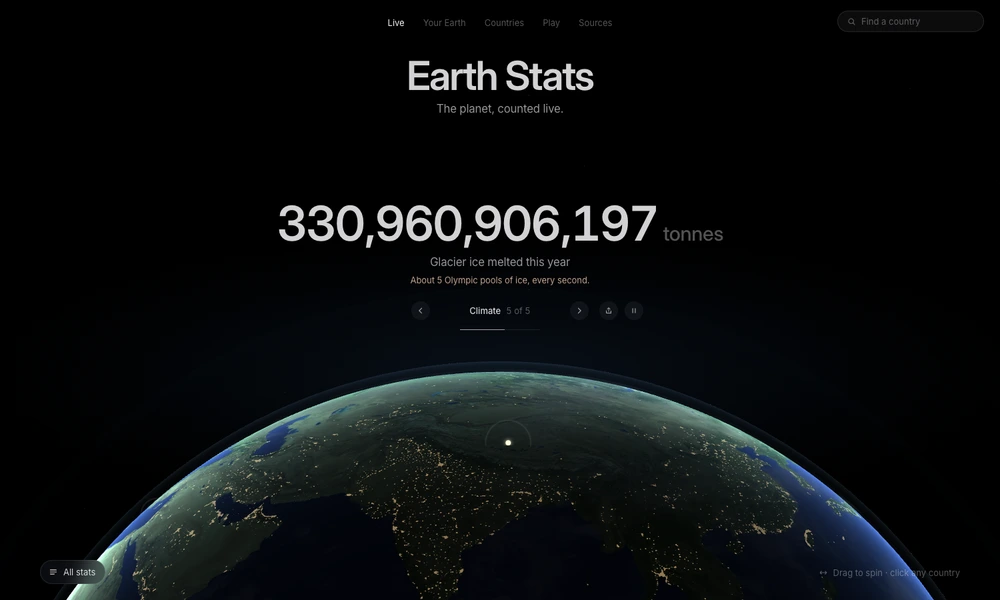
Earth Stats puts environmental and population figures on a rotating globe. Choose a statistic to see what it measures and where it is happening, or select a country to explore that place in more detail. The moving counters illustrate the rate at which estimates change. A sources section explains where the numbers come from and how the site calculates them. Visitors can also enter a birth date locally to see changes over their own lifetime, or use the planet quiz as a starting point for a classroom discussion.
Tried it? Share a useful thought or ask a question.
Good conversations start with a hello.
Sign in to commentTurn spreadsheet and structured data files into shareable dashboards
Turn datasets into charts and publishable visual stories
Create charts, maps, and tables without code
Turn tabular data into editable charts with a free browser-based tool
Build interactive charts and Python data apps, then publish them for others
Turn spreadsheets into charts for reports, presentations and the web