

Datastripes
Turn spreadsheet and structured data files into shareable dashboards
Turn spreadsheets into charts for reports, presentations and the web
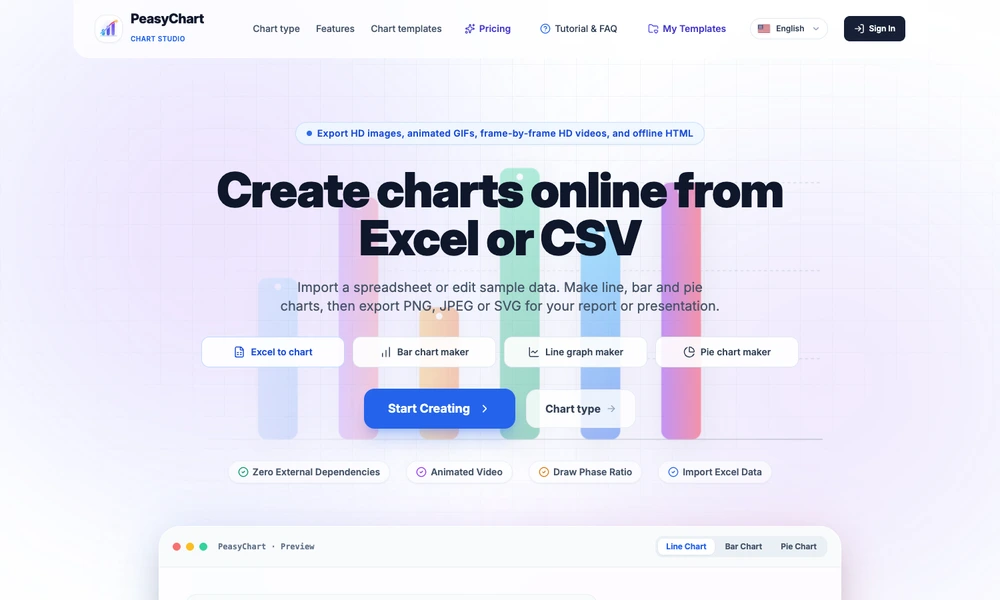
PeasyChart turns a table of numbers into a chart you can use in a report or slide deck. Start from an Excel or CSV file, edit the sample data, or pick a chart template and replace its values. The canvas updates as you make changes, so you can try a line chart for a trend and a bar chart for comparisons before settling on a format. Colors, fonts, axes, legends and data labels are editable. For delivery, choose a still image, vector graphic or an animated output.
Tried it? Share a useful thought or ask a question.
Good conversations start with a hello.
Sign in to commentTurn spreadsheet and structured data files into shareable dashboards
Turn datasets into charts and publishable visual stories
Create charts, maps, and tables without code
Turn tabular data into editable charts with a free browser-based tool
Build interactive charts and Python data apps, then publish them for others
Combine code, data, and interactive explanations in collaborative notebooks